Proof, not promises.
Every trade, every month — publicly verifiable on MyFXBook. Read-only investor access to the live account, with a verified track record indicating the displayed history matches what MyFXBook receives from the connected broker account.
Maximum drawdown to date is 0.86% measured at account level, which does not change with amplification. Measured against your own deposit it is approximately 20.6% at 24×. Amplified accounts carry a hard broker-side drawdown limit — −5% at 24× and −10% at 12×, measured at account level — and a breach liquidates the account, so your maximum loss is the capital you deposited.
Monthly performance, publicly verifiable.
Every green bar is a month of live trading on the connected broker account, as displayed by MyFXBook. No cherry-picked screenshots, no back-tests.
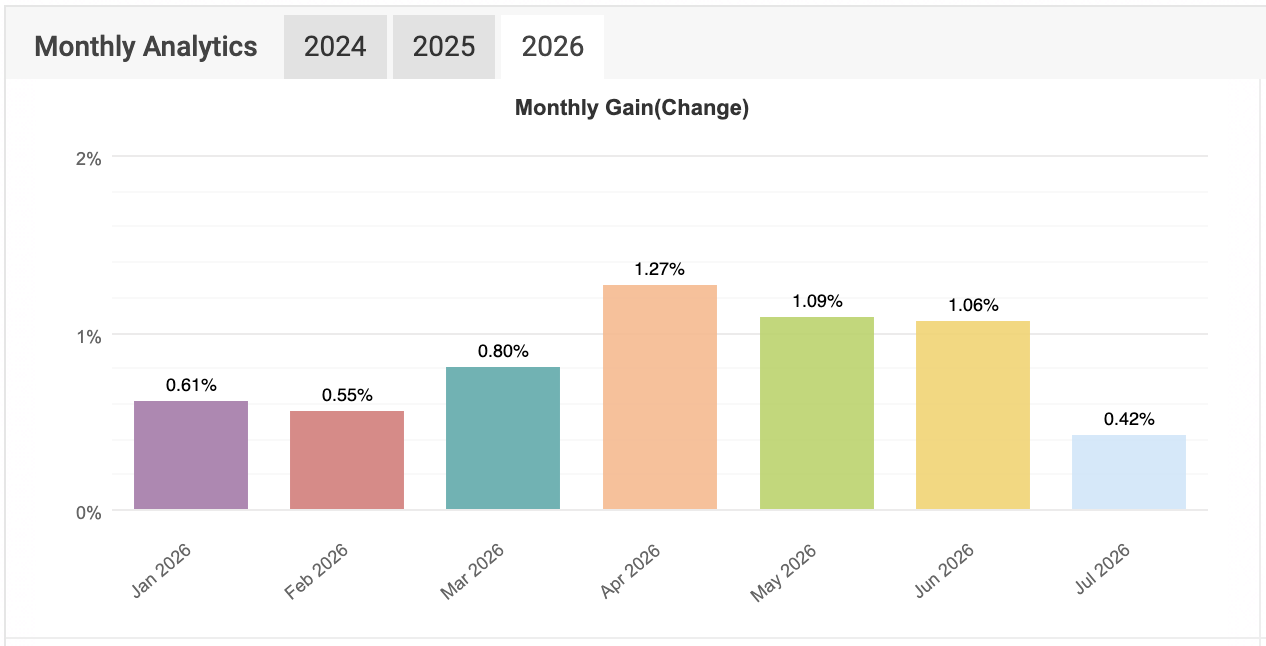
Slow, boring, consistent. Sonic AI isn't built to shoot the lights out — it's built to compound at a rate you can rely on, month after month.
Anyone on the internet can inspect every entry, exit, price and PnL — the same account, the same numbers. Nothing about the ledger is editable by us.
Most positions close within minutes, but some trades stay open longer — as the strategy manages risk. Recent trading activity shows no overnight or weekend holds — positions have consistently closed within the same session.
Inspect on MyFXBookA live trade ledger, line by line.
Every trade Sonic AI has ever taken — open, close, price, PnL, duration — visible to anyone with the link.
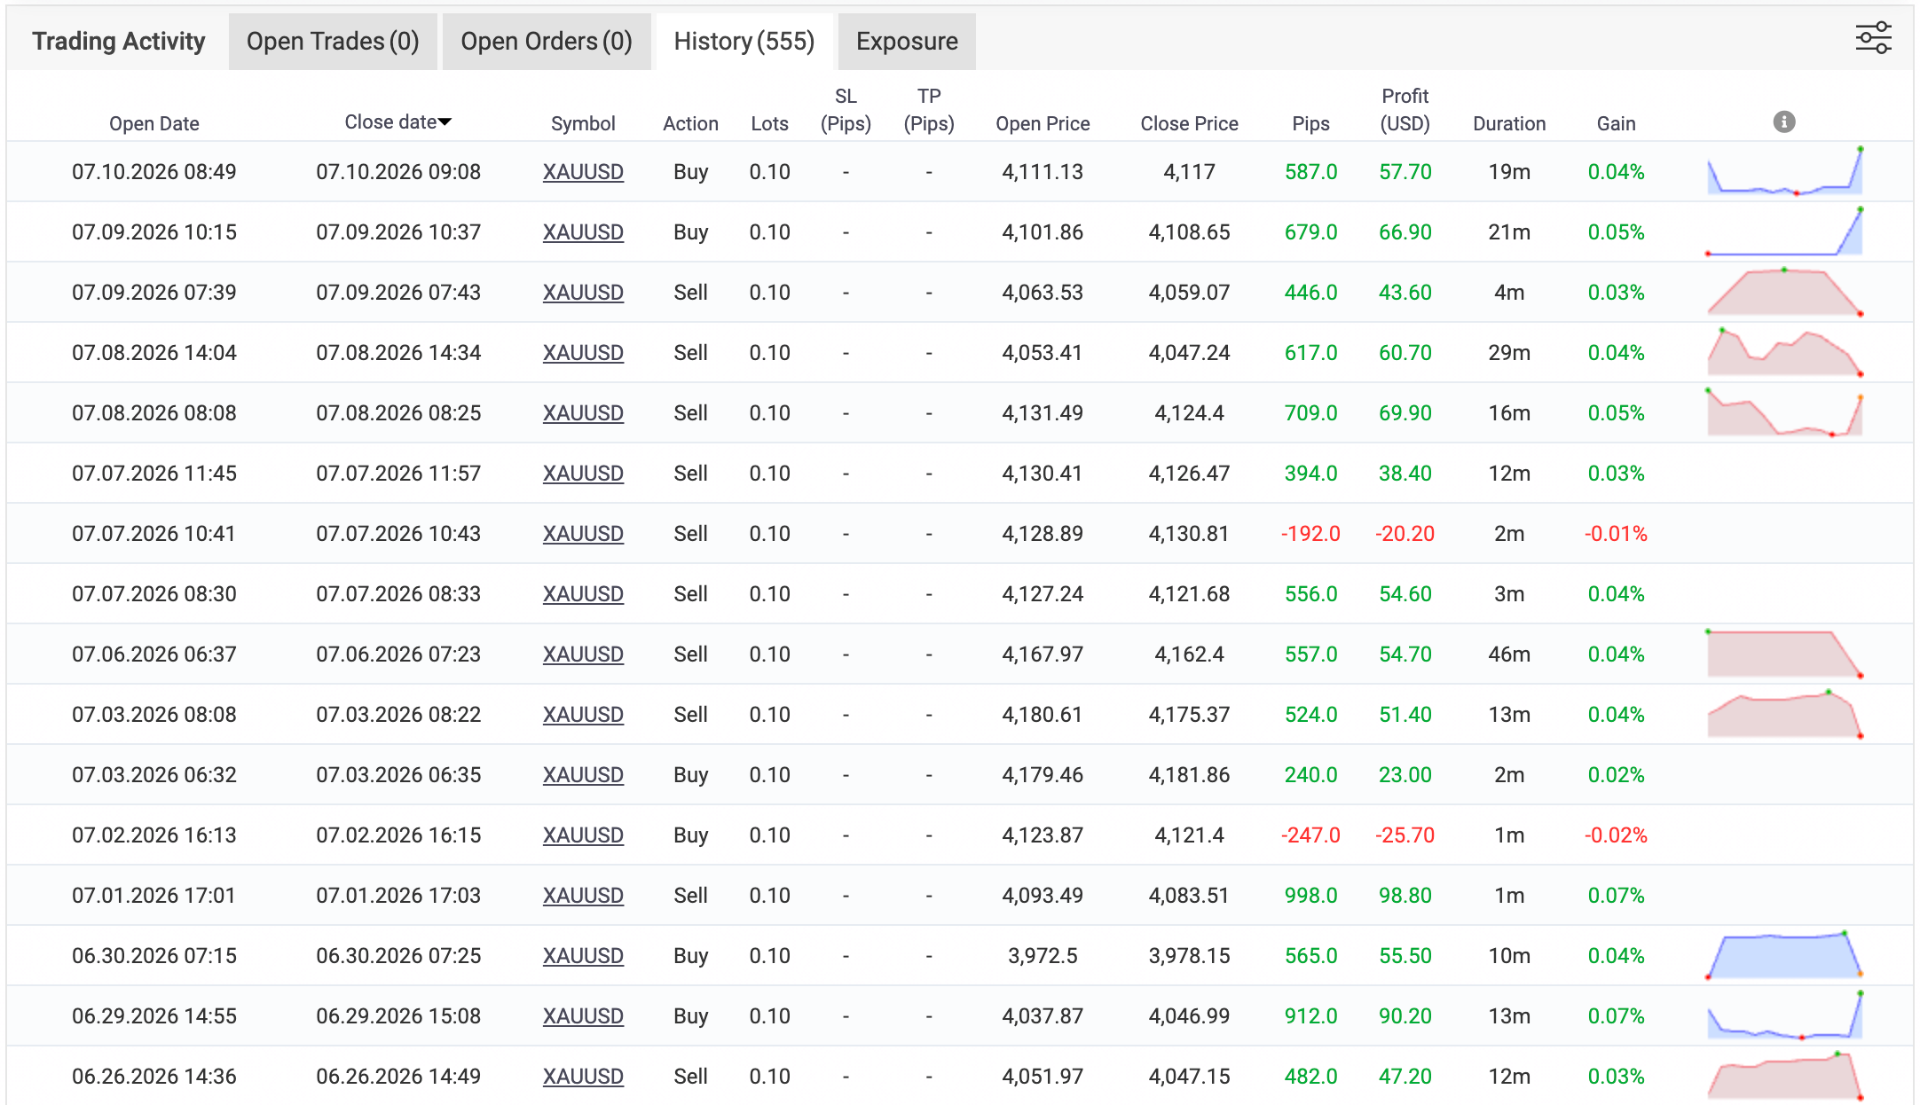
A straight line, up and to the right.
The full MyFXBook Stats and Growth panel — from inception through today.
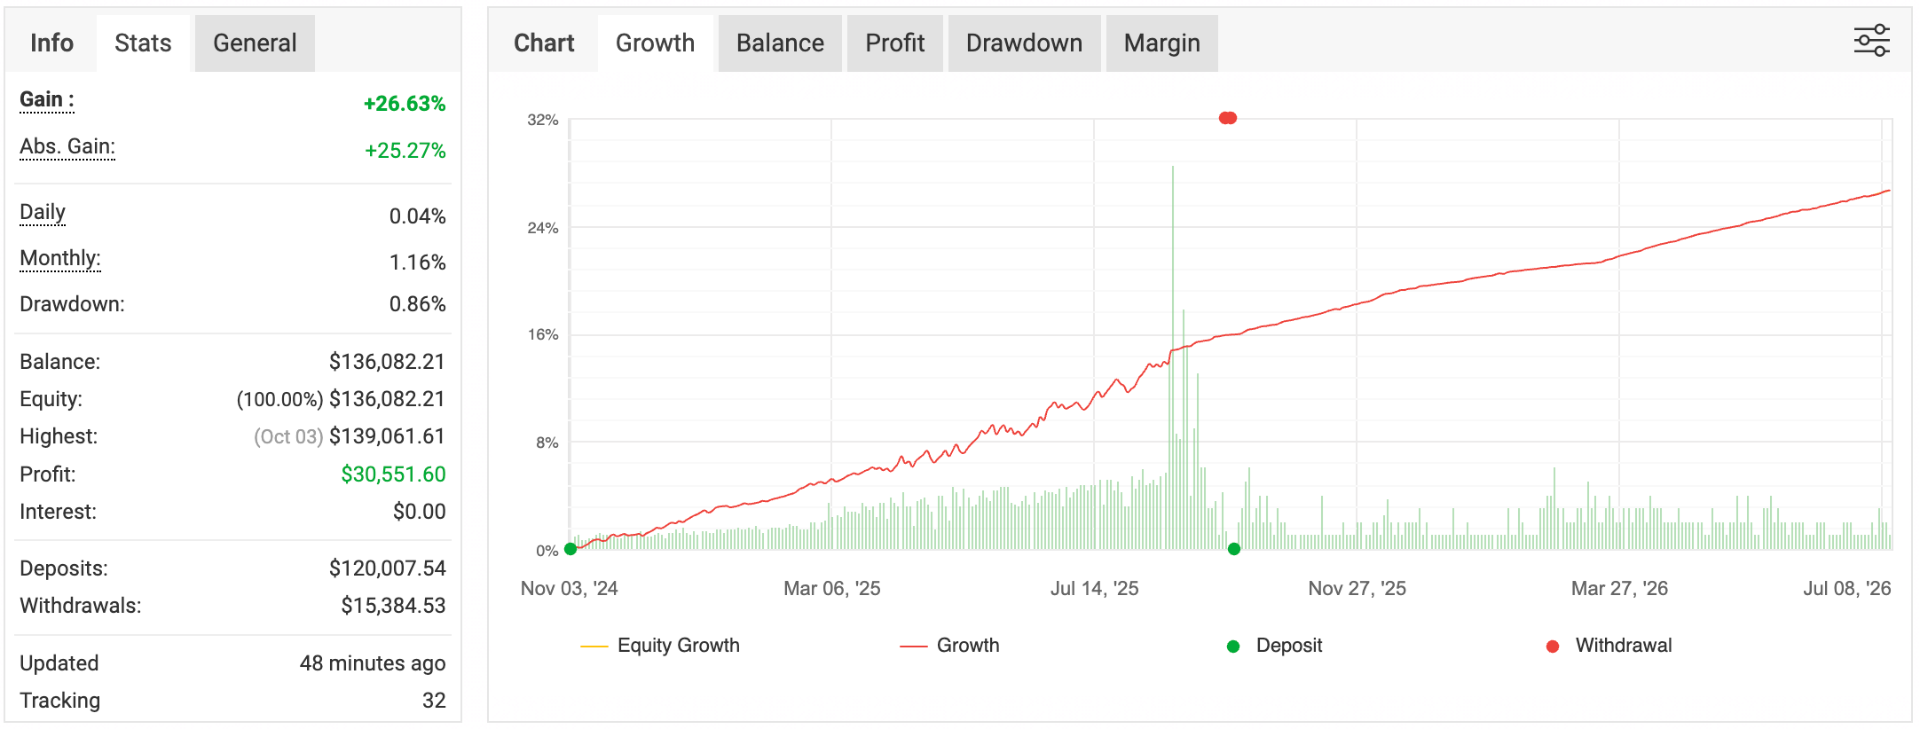
The numbers behind the curve.
All figures are read directly from MyFXBook's verified Stats panel. Nothing here is estimated or rounded in our favor. All figures below are measured on the underlying 1× MyFXBook strategy, not on an amplified investor account.
Maximum drawdown to date is 0.86% measured at account level, which does not change with amplification. Measured against your own deposit it is approximately 20.6% at 24×. Amplified accounts carry a hard broker-side drawdown limit — −5% at 24× and −10% at 12×, measured at account level — and a breach liquidates the account, so your maximum loss is the capital you deposited.
Where these performance figures come from.
Sonic AI historical performance figures on this page are sourced from the linked public MyFXBook account, which you can inspect yourself. Illustrative calculations and projections on this page are clearly labelled and are not sourced from MyFXBook. Historical performance does not guarantee future results.
Profit Projection Engine
Modeled from the verified MyFXBook average monthly return of 1.14%, amplified 24× by broker leverage, minus a 30% performance fee. Leverage amplifies both gains and losses.
Illustrative only — not a guarantee. This is a mathematical illustration based on historical average performance, not a forecast. Individual months have ranged from +0.35% to +2.10% unleveraged. The 24× leverage assumption is an approximation — real leveraged trading involves margin requirements and liquidation risk that do not scale in a perfectly linear way. Past performance does not guarantee future results, and you can lose part or all of your capital. Trade only with funds you can afford to lose.
See the same numbers on your own account
Open your account, activate Sonic AI and start compounding your capital in minutes.